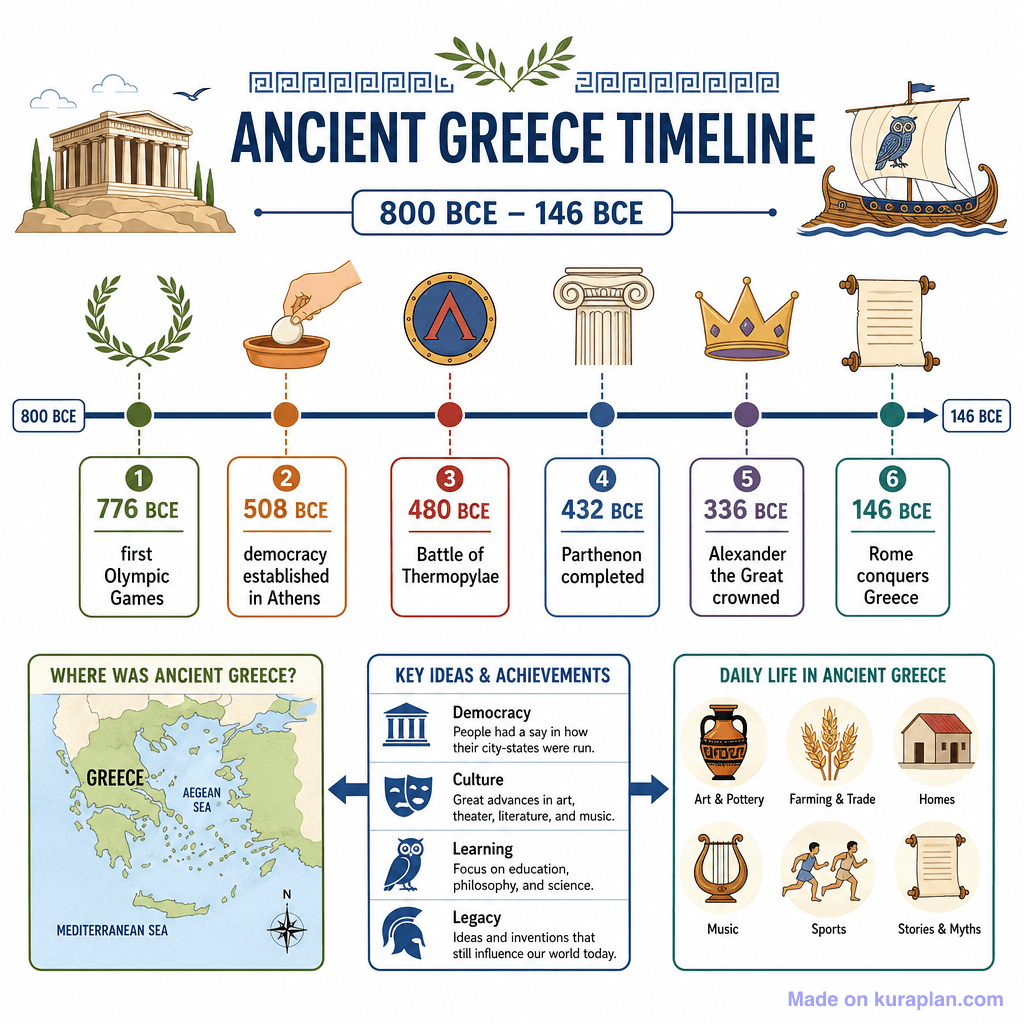
Graph Types — Bar, Pie, Line, Pictograph (simple) — free printable clipart
Free maths resource for teachers · CC BY-NC 4.0
About this illustration
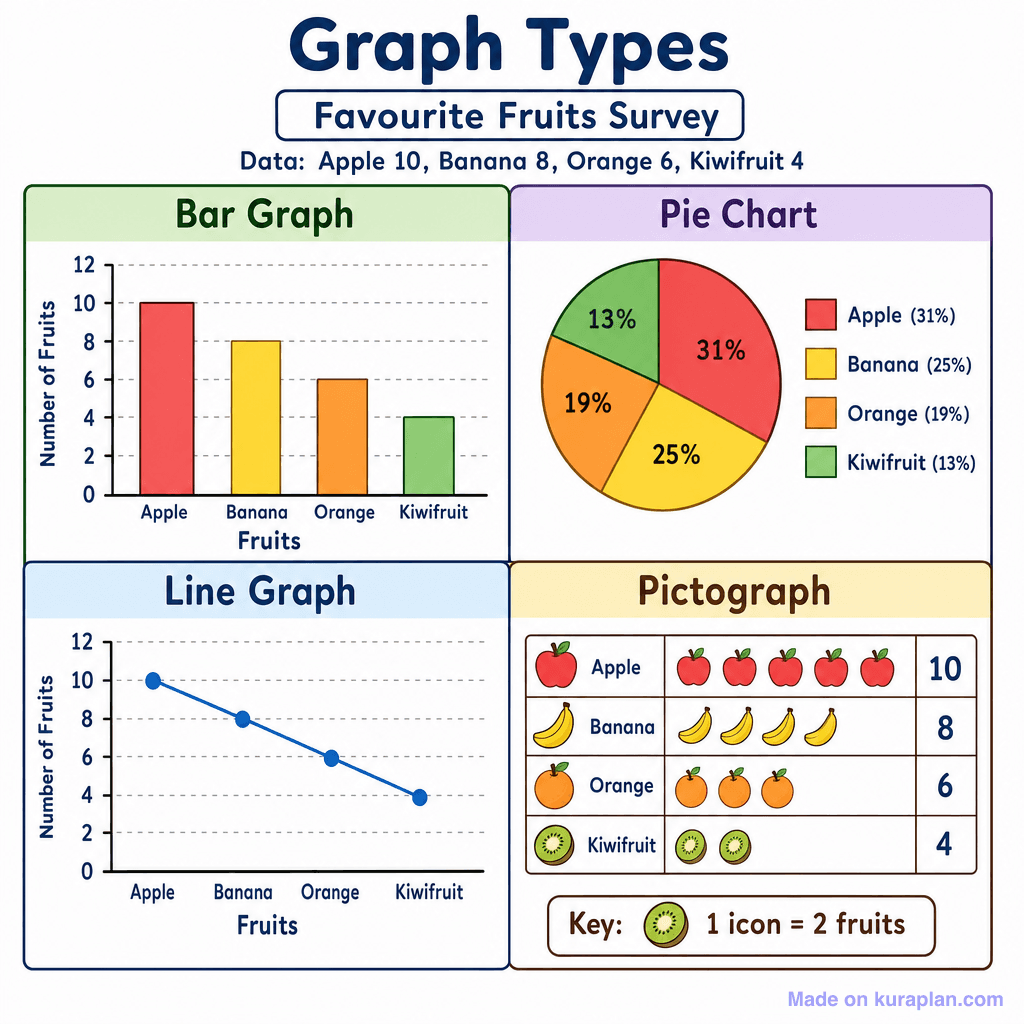
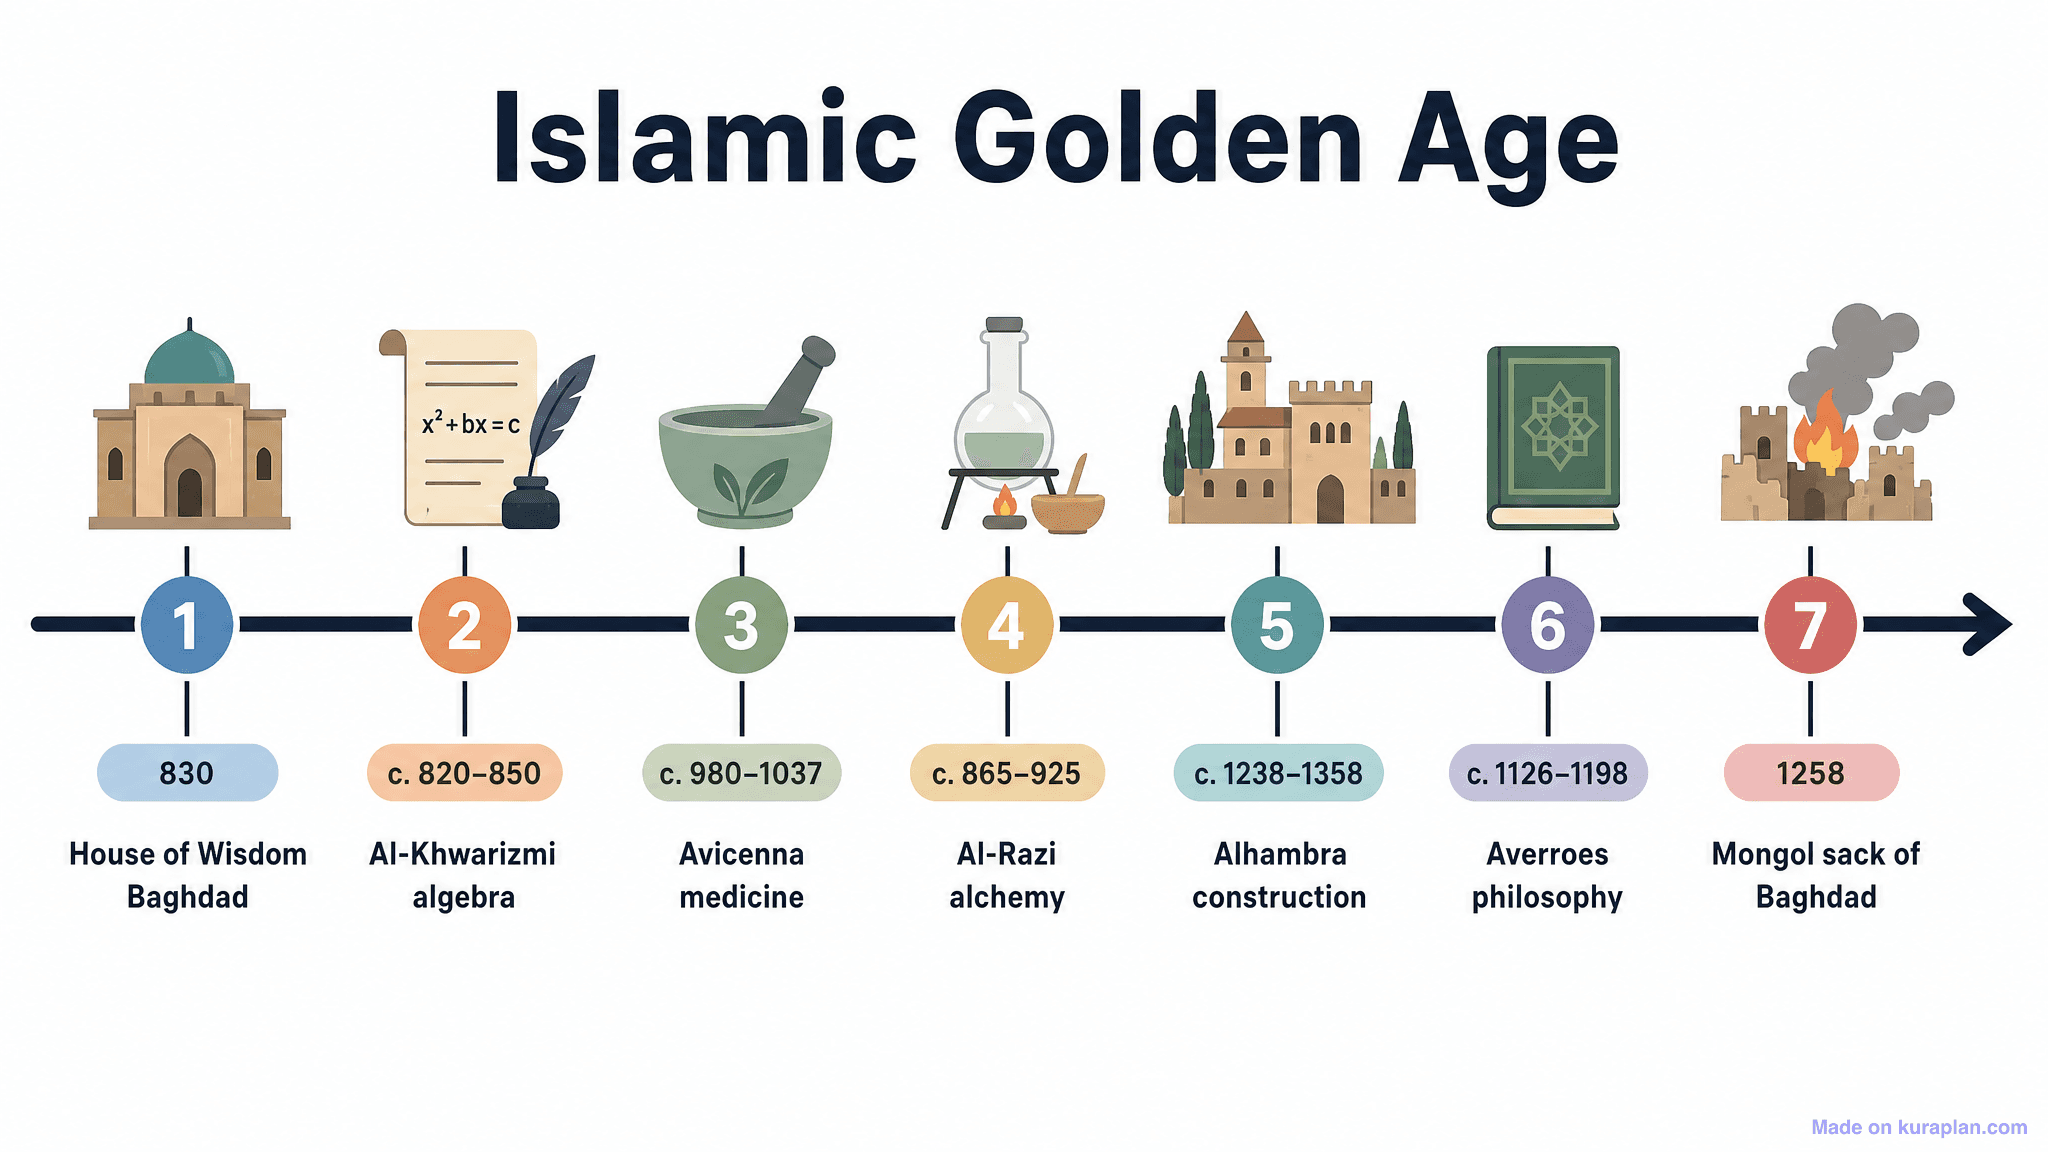
A four-panel reference chart titled 'Graph Types' using a 'Favourite Fruits Survey' dataset (Apple 10, Banana 8, Orange 6, Kiwifruit 4). Each quadrant demonstrates a different graph type — Bar Graph (top-left), Pie Chart (top-right), Line Graph (bottom-left), and Pictograph (bottom-right) — all displaying the same fruit data consistently. The pictograph uses a key of 1 icon = 2 fruits.
How to use
- 1Right-click the image and choose “Save image as”, or use the download button.
- 2Use it in your classroom worksheets, slides or printables — free under CC BY-NC 4.0.
- 3Attribute as “Image by Kuraplan” or link back to kuraplan.com. Not for commercial resale.
Make worksheets with images like this
Kuraplan's editor has the full image library built in — drag-and-drop into a worksheet in seconds.
Browse by subject
18 subjects · 3,800 free illustrations
Cross-Curricular
839 free illustrations

Science
818 free illustrations
English
625 free illustrations
Geography
553 free illustrations

Health
201 free illustrations
social_studies
178 free illustrations

Religious Education
140 free illustrations
Music
130 free illustrations
Art
66 free illustrations
Drama
56 free illustrations
social_sciences
48 free illustrations
History
47 free illustrations
arts
26 free illustrations

pe
25 free illustrations

te_reo_maori
24 free illustrations

tech
16 free illustrations

culture
7 free illustrations

languages
1 free illustrations