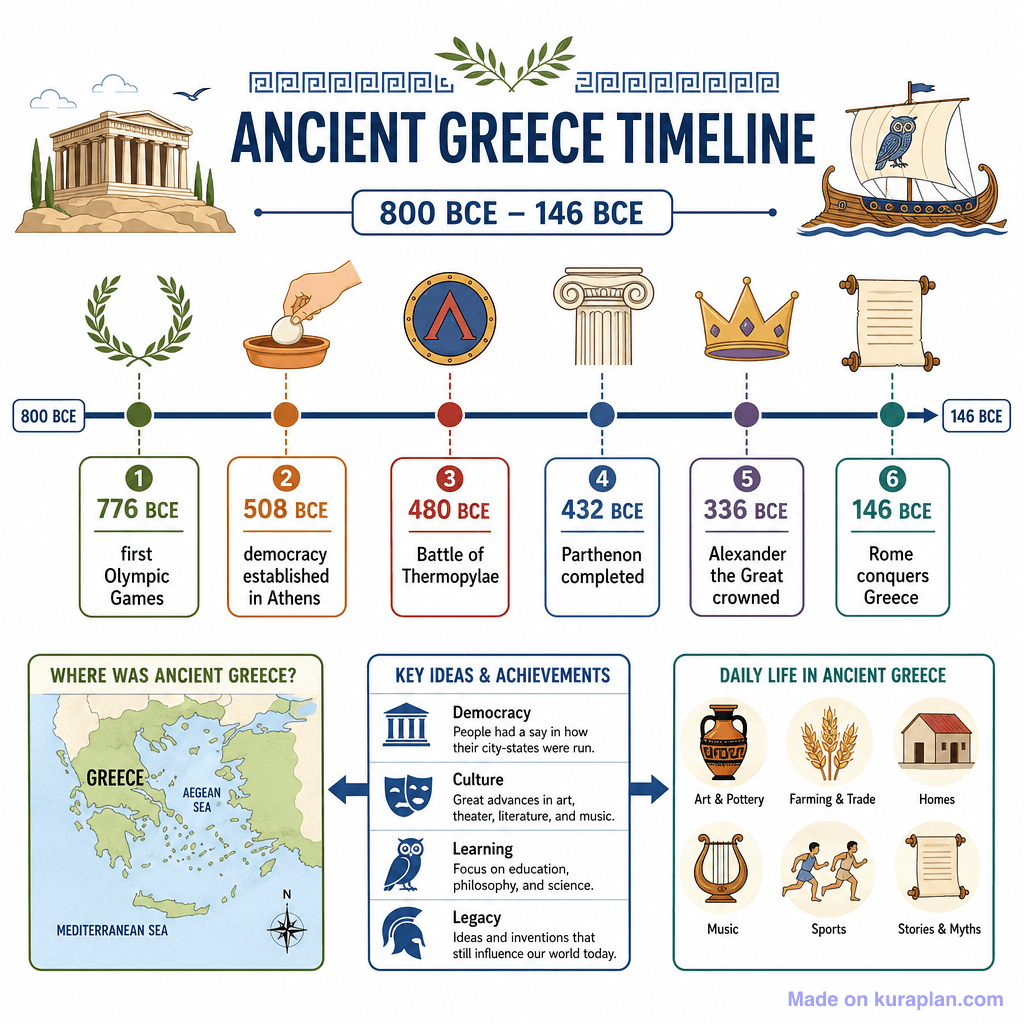
Kinetic and Potential Energy Transfer (simple) — free printable diagram
Free science resource for teachers · CC BY-NC 4.0
About this illustration
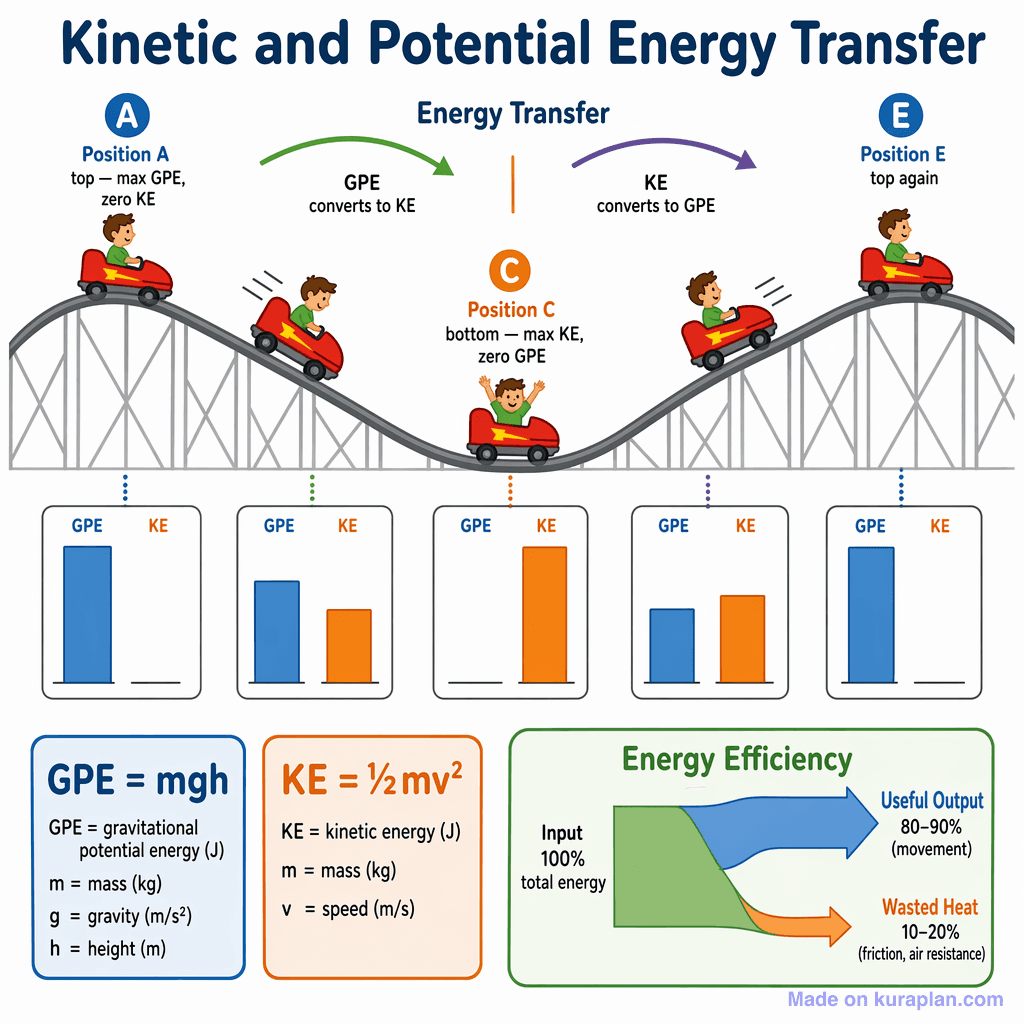
A roller-coaster diagram illustrating kinetic and potential energy transfer across five positions (A through E). Position A (top left) is labelled 'max GPE, zero KE'; Position C (bottom centre) is labelled 'max KE, zero GPE'; Position E (top right) is labelled 'top again'. Bar charts below each position show relative GPE (blue) and KE (orange) levels. Arrows show 'GPE converts to KE' (downhill) and 'KE converts to GPE' (uphill). Formula boxes define GPE = mgh and KE = ½mv². An Energy Efficiency Sankey-style diagram shows 100% input splitting into 80–90% useful output (movement) and 10–20% wasted heat (friction, air resistance).
How to use
- 1Right-click the image and choose “Save image as”, or use the download button.
- 2Use it in your classroom worksheets, slides or printables — free under CC BY-NC 4.0.
- 3Attribute as “Image by Kuraplan” or link back to kuraplan.com. Not for commercial resale.
Make worksheets with images like this
Kuraplan's editor has the full image library built in — drag-and-drop into a worksheet in seconds.
Browse by subject
18 subjects · 4,894 free illustrations

Maths
1,912 free illustrations

Cross-Curricular
839 free illustrations

English
625 free illustrations
Geography
553 free illustrations

Health
201 free illustrations
social_studies
178 free illustrations

Religious Education
140 free illustrations
Music
130 free illustrations

Art
66 free illustrations

Drama
56 free illustrations
social_sciences
48 free illustrations
History
47 free illustrations

arts
26 free illustrations

pe
25 free illustrations

te_reo_maori
24 free illustrations

tech
16 free illustrations

culture
7 free illustrations

languages
1 free illustrations