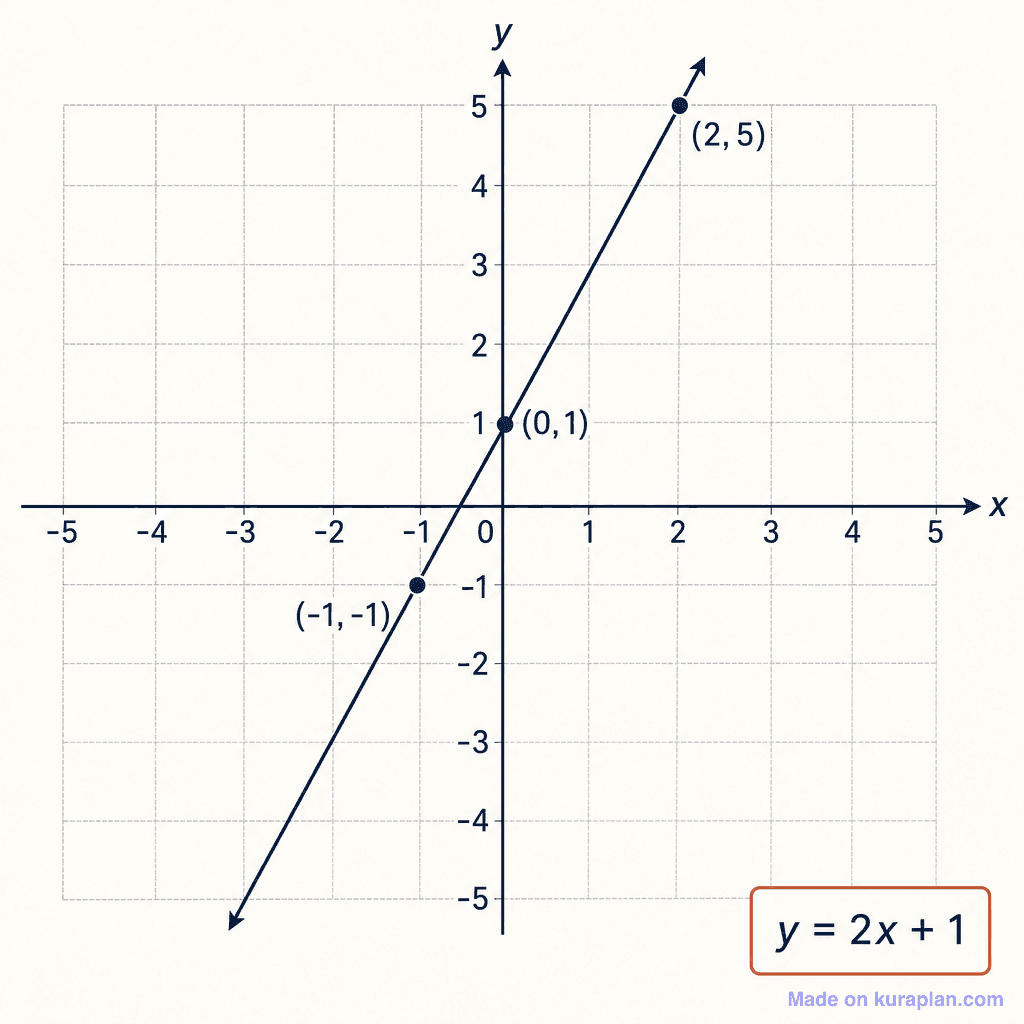
Linear equation graph y = 2x + 1 — free printable diagram
Free maths resource for teachers · CC BY-NC 4.0
About this illustration
This image displays a Cartesian coordinate plane with labeled x and y axes, each ranging from -5 to 5. A straight line is plotted on the grid, passing through the points (-1, -1), (0, 1), and (2, 5), which are clearly marked. The equation of this linear function, y = 2x + 1, is presented in a brown-bordered box in the bottom right corner. This visual aid is ideal for teaching concepts of linear equations, graphing lines, and understanding the relationship between an equation and its graphical representation in mathematics. It is suitable for slide presentations, worksheets for plotting or identifying equations, or as part of a label exercise. The visual style is a clear, flat illustration diagram.
How to use
- 1Right-click the image and choose “Save image as”, or use the download button.
- 2Use it in your classroom worksheets, slides or printables — free under CC BY-NC 4.0.
- 3Attribute as “Image by Kuraplan” or link back to kuraplan.com. Not for commercial resale.
Make worksheets with images like this
Kuraplan's editor has the full image library built in — drag-and-drop into a worksheet in seconds.
Browse by subject
18 subjects · 3,800 free illustrations

Cross-Curricular
839 free illustrations

Science
818 free illustrations
English
625 free illustrations
Geography
553 free illustrations

Health
201 free illustrations
social_studies
178 free illustrations

Religious Education
140 free illustrations
Music
130 free illustrations

Art
66 free illustrations

Drama
56 free illustrations

social_sciences
48 free illustrations

History
47 free illustrations

arts
26 free illustrations

pe
25 free illustrations

te_reo_maori
24 free illustrations

tech
16 free illustrations

culture
7 free illustrations

languages
1 free illustrations