Pictogram Row Template — free printable diagram
Free maths resource for teachers · CC BY-NC 4.0
About this illustration
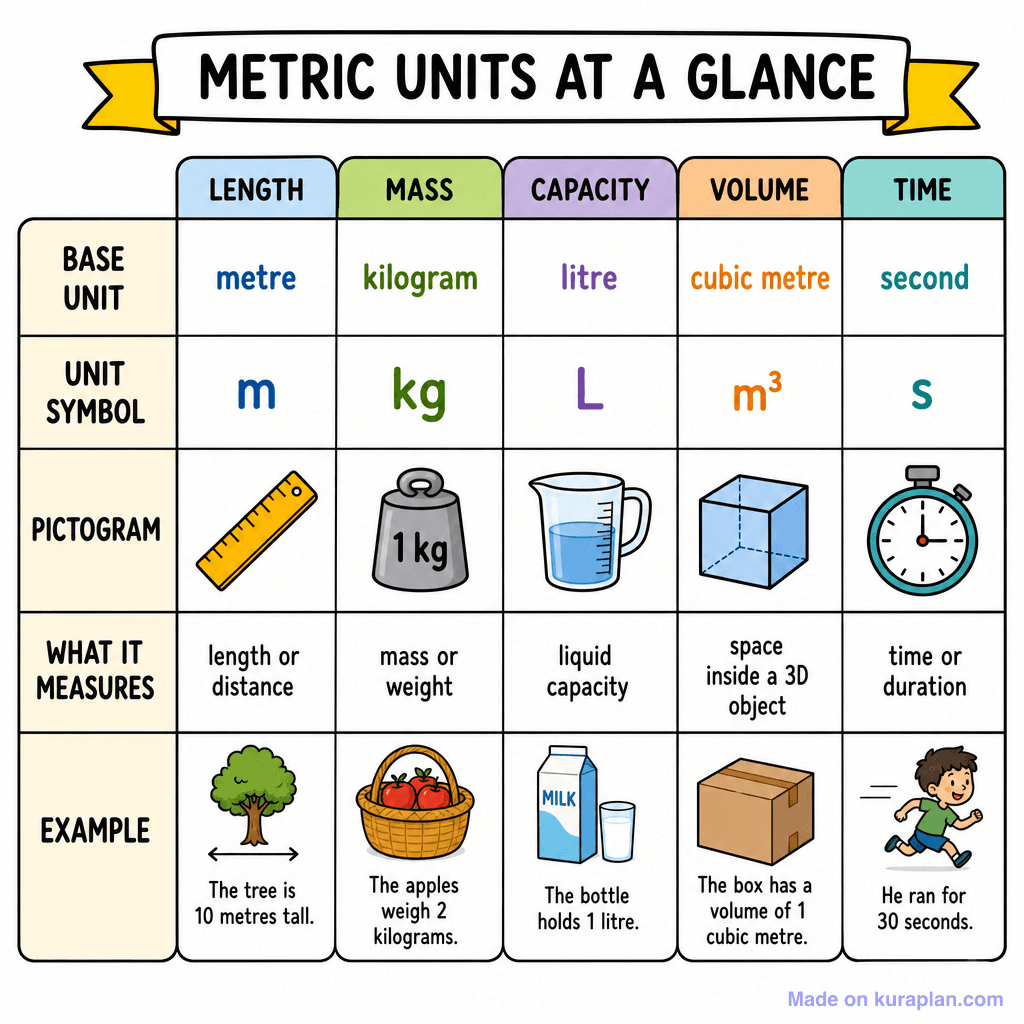
This colourful illustration presents a comprehensive table that clearly outlines various metric units. It systematically details units for length, mass, capacity, volume, and time, showcasing their base unit names, unit symbols, illustrative pictograms, a description of what each measures, and a relatable real-world example. This educational resource is suitable for teaching fundamental measurement concepts in K-6 maths and science. It can be effectively used on classroom slides, as a reference chart on worksheets, or as a visual aid for labeling exercises. The image employs a clean, flat illustration style with vibrant colours to make complex information accessible.
How to use
- 1Right-click the image and choose “Save image as”, or use the download button.
- 2Use it in your classroom worksheets, slides or printables — free under CC BY-NC 4.0.
- 3Attribute as “Image by Kuraplan” or link back to kuraplan.com. Not for commercial resale.
Make worksheets with images like this
Kuraplan's editor has the full image library built in — drag-and-drop into a worksheet in seconds.
Related illustrations
More from Statistics & Probability


Browse by subject
18 subjects · 3,803 free illustrations

Cross-Curricular
839 free illustrations

Science
818 free illustrations

English
626 free illustrations

Geography
555 free illustrations

Health
201 free illustrations

social_studies
178 free illustrations

Religious Education
140 free illustrations
Music
130 free illustrations

Art
66 free illustrations

Drama
56 free illustrations

social_sciences
48 free illustrations
History
47 free illustrations
arts
26 free illustrations
pe
25 free illustrations

te_reo_maori
24 free illustrations

tech
16 free illustrations

culture
7 free illustrations

languages
1 free illustrations