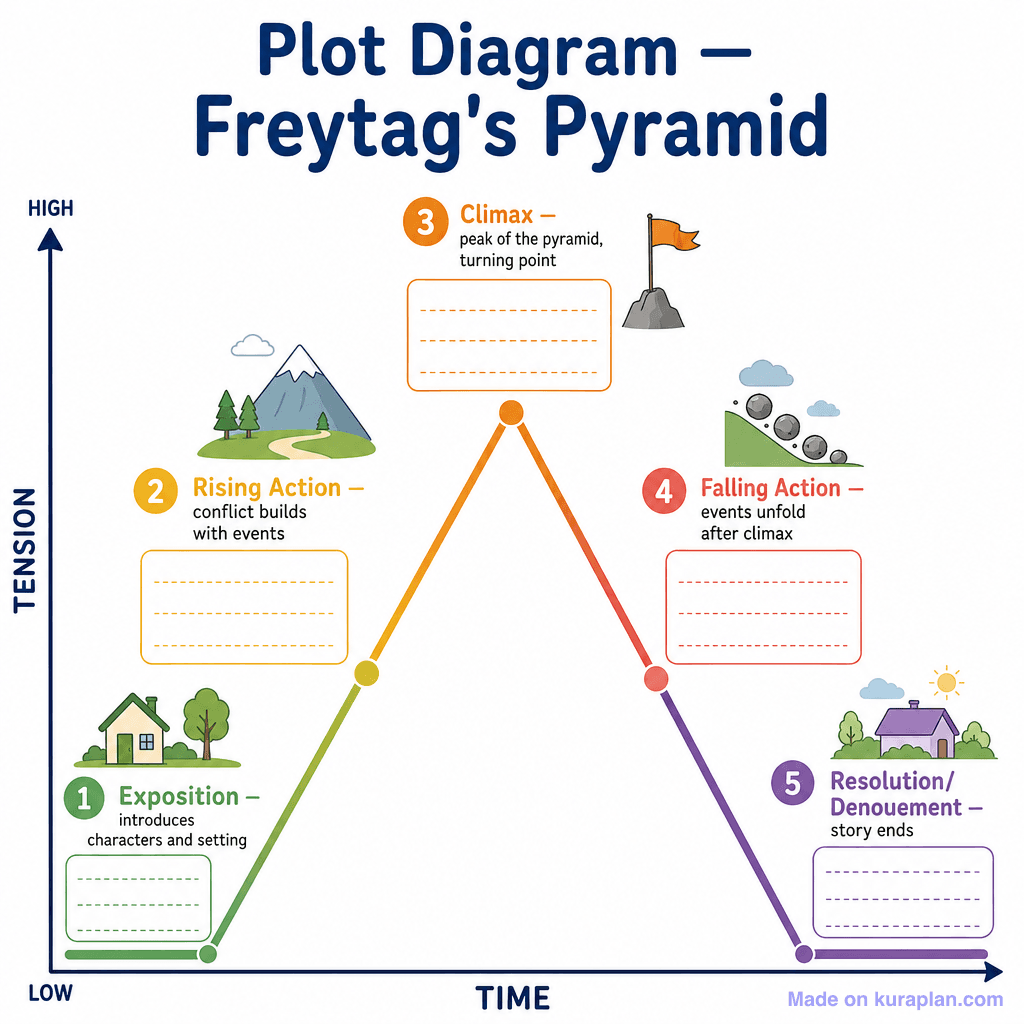
Plot Diagram — Freytag's Pyramid (simple) — free printable diagram
Free english resource for teachers · CC BY-NC 4.0
About this illustration
A colour-coded Freytag's Pyramid plot diagram on a white background with TENSION (vertical) and TIME (horizontal) axes. Five numbered stages are marked along a rising-then-falling line: 1 Exposition (green, bottom-left), 2 Rising Action (yellow-orange, mid-left), 3 Climax (orange, apex), 4 Falling Action (red-pink, mid-right), 5 Resolution/Denouement (purple, bottom-right). Each stage has a short descriptor, a matching icon, and a lined write-in box. The pyramid line rises steeply from Exposition through Rising Action to Climax, then falls steeply to Resolution.
How to use
- 1Right-click the image and choose “Save image as”, or use the download button.
- 2Use it in your classroom worksheets, slides or printables — free under CC BY-NC 4.0.
- 3Attribute as “Image by Kuraplan” or link back to kuraplan.com. Not for commercial resale.
Make worksheets with images like this
Kuraplan's editor has the full image library built in — drag-and-drop into a worksheet in seconds.
Browse by subject
18 subjects · 5,087 free illustrations
Maths
1,912 free illustrations

Cross-Curricular
839 free illustrations

Science
818 free illustrations
Geography
553 free illustrations

Health
201 free illustrations
social_studies
178 free illustrations

Religious Education
140 free illustrations
Music
130 free illustrations

Art
66 free illustrations

Drama
56 free illustrations
social_sciences
48 free illustrations
History
47 free illustrations

arts
26 free illustrations

pe
25 free illustrations

te_reo_maori
24 free illustrations

tech
16 free illustrations

culture
7 free illustrations

languages
1 free illustrations