Mean, Median, Mode and Range Visual Guide (simple) — free printable diagram
Free maths resource for teachers · CC BY-NC 4.0

About this illustration
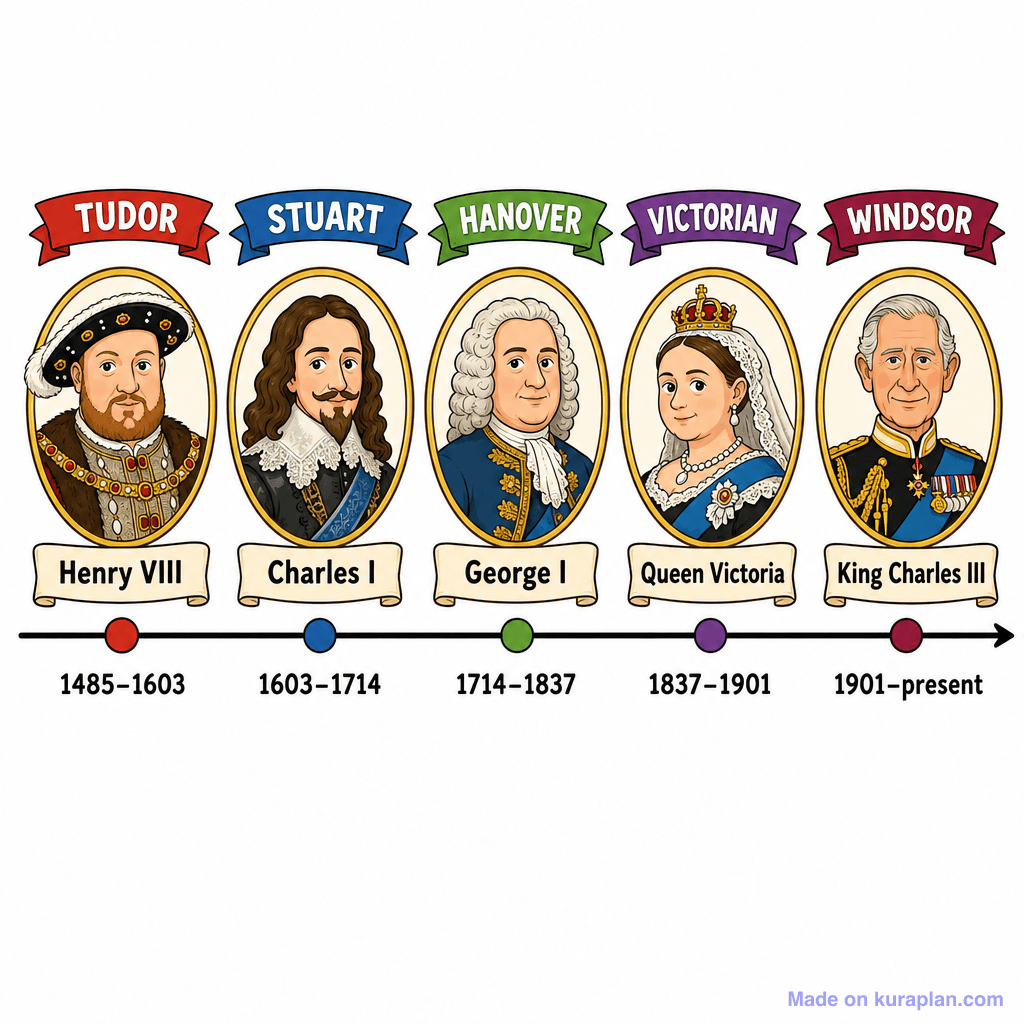
A four-panel visual guide covering Mean, Median, Mode and Range using the dataset {3, 5, 5, 7, 9, 11}. The Mean panel shows a balance scale with the sum and count formula, calculating 40 ÷ 6 = 6.67. The Median panel shows an ordered number line identifying the 3rd and 4th values (5 and 7) as middle values, calculating (5+7)÷2 = 6. The Mode panel shows a tally/bar chart table identifying 5 as the most frequent value. The Range panel shows a number line from 3 to 11 with the formula max − min = 11 − 3 = 8.
How to use
- 1Right-click the image and choose “Save image as”, or use the download button.
- 2Use it in your classroom worksheets, slides or printables — free under CC BY-NC 4.0.
- 3Attribute as “Image by Kuraplan” or link back to kuraplan.com. Not for commercial resale.
Make worksheets with images like this
Kuraplan's editor has the full image library built in — drag-and-drop into a worksheet in seconds.
Browse by subject
18 subjects · 3,800 free illustrations
Cross-Curricular
839 free illustrations

Science
818 free illustrations
English
625 free illustrations
Geography
553 free illustrations

Health
201 free illustrations
social_studies
178 free illustrations

Religious Education
140 free illustrations
Music
130 free illustrations
Art
66 free illustrations
Drama
56 free illustrations
social_sciences
48 free illustrations
History
47 free illustrations
arts
26 free illustrations
pe
25 free illustrations

te_reo_maori
24 free illustrations

tech
16 free illustrations

culture
7 free illustrations

languages
1 free illustrations